

app.speqqle has all the functions you need for the analysis of your spectroscopic data!
Are you just starting to learn about spectroscopy or are you already an expert? We built app.speqqle to give you all the tools you need to analyse your spectroscopy data — all in one place. Easily to get the information you need from your data! Here you can find out everything app.speqqle can do for you.

Materials & Samples
Is your sample a semiconductor wafer, a coated material, a layered stack of paint or complex materials or even a gas?
With app.speqqle you can analyse all your data in one place! It supports bulk, multilayer or gas samples. Each component of your sample (layer or gas component) is described by a material model that describes its optical response.

Experiments
Do you do optical spectroscopy experiments?
With app.speqqle you can analyse data from almost every optical spectroscopy technique including:
Far field spectroscopy:
Reflectivity
Transmission
Absorbance
Ellipsometry
THz time-domain (coming soon)
Near field spectroscopy:
Bulk Point Dipole model
Bulk Finite Dipole model
Multilayer Finite Dipole model (coming soon)

Fitting
Are you looking for an easy way to fit optical spectroscopy data?
With app.speqqle, your data is fitted automatically once you select your experiment. No coding required — it’s literally just one click.

Outputs
Do you need to get a specific information from your spectroscopy experiment?
Optical spectra contain a treasure of information and with app.speqqle you can choose which outputs you are interested in:
Dielectric constant
Refractive index
Loss function
Optical penetration depth
Optical spectral weight
Conductivity
Layer thickness (for multilayer samples)
Temperature (for Raman spectroscopy)

Lineshapes
Are you a more experienced user and want to choose the line shapes of your fit?
At the moment app.speqqle lets you select between the following line shapes:
Drude-Lorentz
Tauc-Lorentz
Fano
Cauchy
Sellmeier and many more …

Multianalysis
Do you want to analyse more than one spectroscopy experiment at the same time?
A special feature of app.speqqle is the multianalysis of more than one experiment at the same time. If you have, for example, data from an ellipsometry and a transmission experiment on the same sample, you can fit both at the same time to increase the precision of your result.)
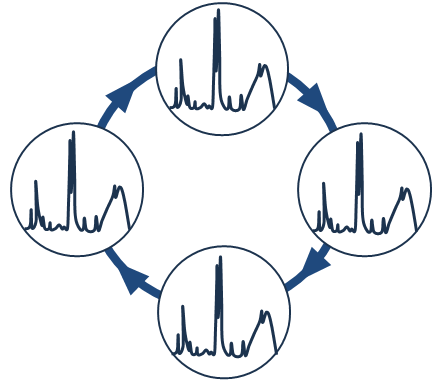
Batch
Do you want to analyse not only one spectrum but an entire data set?
With the batch functionality of app.speqqle you can repeat the analysis defined for one spectrum for other spectra as many times as needed.